

Do you feel like you are drowning in data when you download your Facebook Insights and you don’t know how to make sense of all the numbers? Spreadsheets can be overwhelming and it’s hard to know where to start.
I’m going to give you a step-by-step way to analyze your data so that you can see exactly which types of Facebook Posts are working the best for you and getting the most engagement.
But first let’s talk about why you need to download your data in the first place – isn’t it enough to just look at the Facebook Insights area? Facebook Insights can be a great way to get some daily or weekly info but you should do a deeper dive for these reasons:
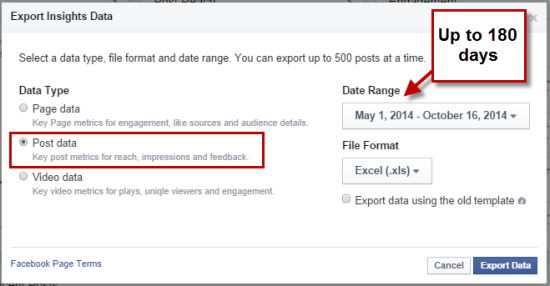
- You can export a longer period of data – up to 180 days at a time and 500 posts max. This allows you to do a deep dive once a quarter so you can really spot trends
- You can manipulate the data in different ways. Sort by different columns and even use Excel Pivot Tables to compare different numbers.
- You can do more testing and add your own data to compare. Want to know if hashtags are having any affect? Add that into your Excel spreadsheet and notice patterns.
There are a lot of things you can do with Facebook Insights data but to analyze which posts are working well to get engagement, start with this Insights exercise:
1. Download your Post-level data
Once you go to your Facebook Insights and click Export, you can select Page data or Post data. To analyze your post engagement, select the Post data If you are getting an error or getting no response at all you may be trying to export more than 500 posts or longer than 180 days – try shortening the time frame.
Your download will go automatically into your Downloads folder and the file will be named “Facebook Insights Data Export (Post Level) – Page name – Date”
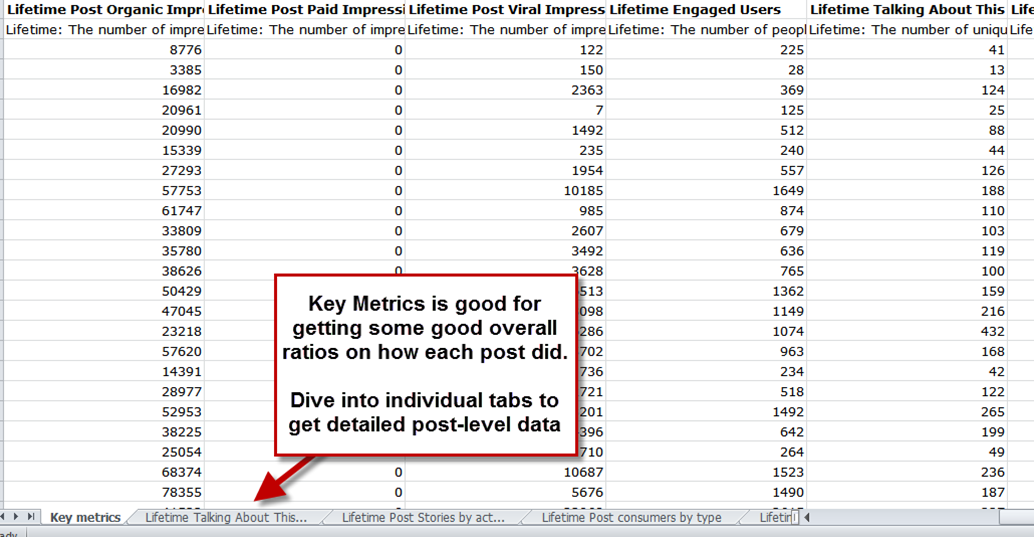
Open the file and Enable Editing. You will see the Key Metrics on the first tab but there are many other tabs where you can dive into the other data.
2. Use Lifetime Talking About This Tab and Lifetime Post consumers by type Tab
The Lifetime Talking About This tab tracks the Comments, Likes, and Shares by unique people. Officially it’s the number of unique people who created a story about your Page post by interacting with it.
The Lifetime Post consumers by type tab tracks the Link clicks, Other clicks (clicking anywhere on the post), and Photo views on your post. Again this tab tracks the Unique Users. These stats can show you the “invisible” engagement of your posts. You know people are paying attention to your post with these stats but they may not be as visible because they aren’t commenting, liking, or sharing the post.
I usually Autofit the column width so they aren’t spread out. Then I combine the two pages into one so I can sort them in different ways and see all of my engagement data in one place.
3. Combine the two tabs into one to see all of your Engagement data.
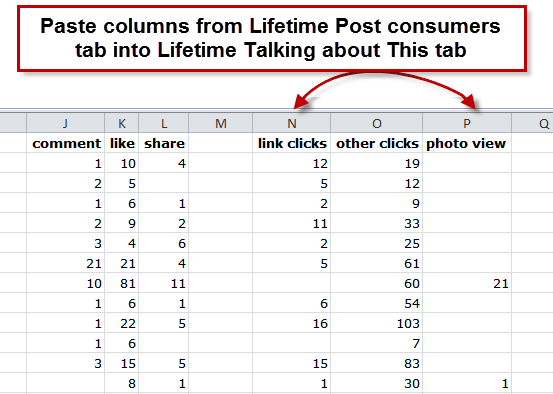
Cut and paste the Link Clicks, Other Clicks and Photo Views, (and also Clicks to Play if you have video posts) columns from the Lifetime Post consumers tab onto the Lifetime Talking About This Tab.
Leave a column between the data for some intermediate calculations.
4. Add formulas
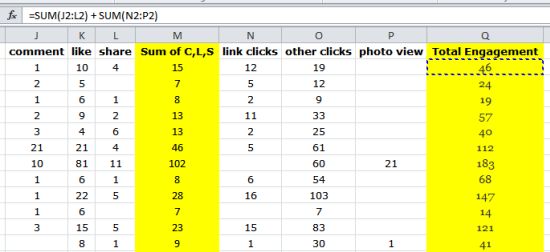
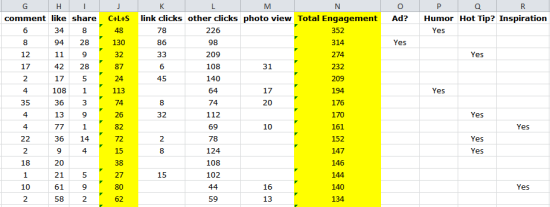
Now sum up some of the columns so that you can sort by them. I like summing the “visible” interaction (comments, likes, and shares) and also the total interaction.
So for this example I would put this formula in space M2: =SUM(J2:L2)
Then I would put this formula into Q1: =SUM(J2:L2) + SUM(N2:P2)
Then copy each of these formulas into the rest of the M and Q column.
5. Add additional information
Here’s the fun part, you can add additional information about the posts that you might want to track. You may want to test certain things, find out how a type of post is really working for you, or flag posts that have been Promoted so you aren’t unfairly giving them too much weight on what types of posts are working for you. This is a manual process but it doesn’t take incredibly long.
Here are some examples of things to track:
- Was it a humorous post?
- Was it Promoted or Boosted?
- Was it breaking news, or inspirational, or some other category of type of post you do regularly?
- Were you testing something in particular? (i.e. keeping the link in the text of the post, or very long text in the post)
Here are some examples of how to add in those columns and track that:
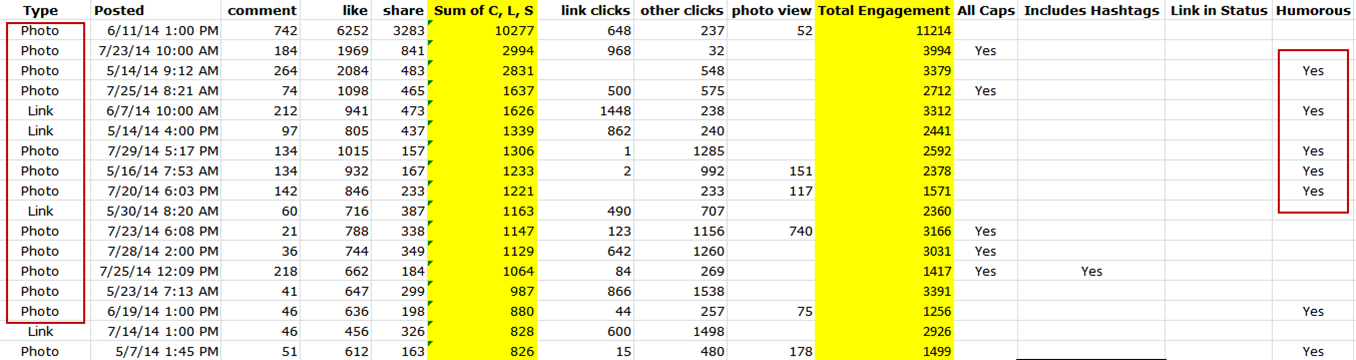
or another example with different things that were being tested. Here we were testing to see if leaving the link in the status led to more Link Clicks as well as a few other tests over this time period:
![]()
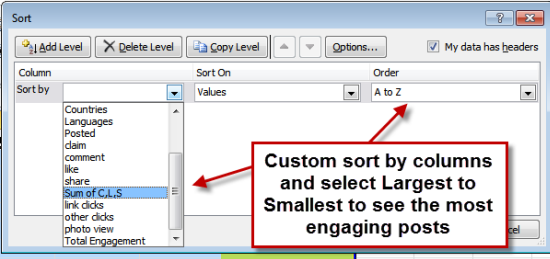
6. Sort by different columns and notice patterns
Now you are going to sort by different columns to gain some insights into what is working. You can sort by Total engagement to see which posts got the most overall interaction or sort by the sum of the comments, likes, and shares to see which posts got the most “visible” interaction.
Go to Sort & Filter in the upper right corner of Excel and select Custom Sort. Now select the column you want to sort by to see different data.
You’ll notice that 7 out of 10 of the top images in the following data are images and 5 out of 10 are humorous posts. But before you draw conclusions you need to know how many posts overall are photo posts or humorous posts to know if that is statistically significant. Be careful when drawing conclusions!
See that wasn’t so painful was it? Easy Peasy as Grandma Mary would say.
Hope that helps you do a deeper dive into your Facebook engagement and sparks some good ideas on tests that you can do to see what works on your Facebook Page.
Make sure you check out my other post on Facebook Insights too.


Great information! I was looking o my FB analytics tonight and realized that I didn’t thoroughly understand all the information. Thank you so much for this insightful article!
Hi Andrea,
This post was very helpful, as I am trying to make some sense of data from my FB insights export. In particular, I’m trying to create a sort of “viral power” index using various correlations like impressions:shares and impressions:likes. I want to use this so I can quickly gauge which posts would be worth promoting for engagement.
Do you know of any tools that do this sort of thing, or do you have an excel macro that works in this way? I planned on paying someone on Elance to create one, but thought I’d drop you a line here, and maybe you’d be so kind as to offer a little insight.
Thanks – this was very helpful!
Good stuff, Andrea! Concise, useful, and not overwhelming. Much appreciated!
Did you try dataddo tool? you can automatically collect Facebook data, consolidate data from multiple pages, mash Facebook data with CSVs etc. Check: http://www.dataddo.com