
 Maybe you’ve heard the frustrating news that Facebook Pages are going to drop in Organic Reach with the latest change in Facebook’s algorithm. Very irritating and I’ll have more information on what to do about it in another post.
The change started to be noticed by many Pages already (in fact some were reporting as high as a 44% decline in Reach). I decided that an experiment was in order. I wanted to see what my engagement level was across all platforms I was participating on.
Now before you get all scientifically pure on me, this isn’t a perfect experiment. And let’s be clear that this is my data – not yours. I would not base your actions on what I found on my statistics. I would encourage you to run your own types of experiments to see your own results.
The results I got from this experiment were very surprising.
Here is what I did and some disclaimers about my existing social media activity so you know a little about my history.
The Experiment
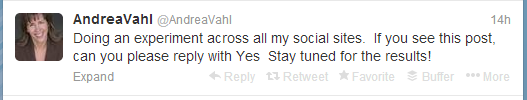
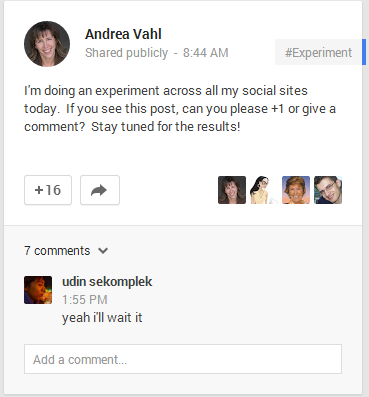
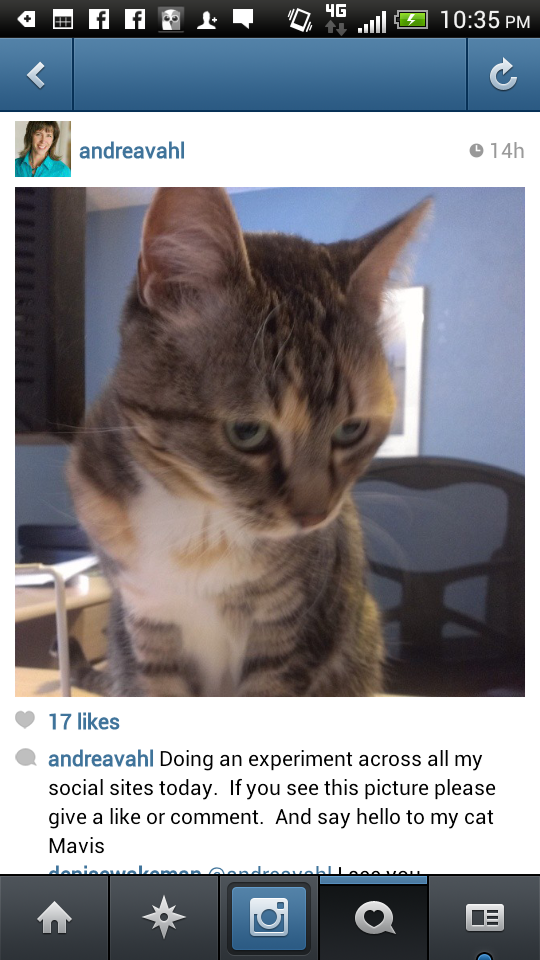
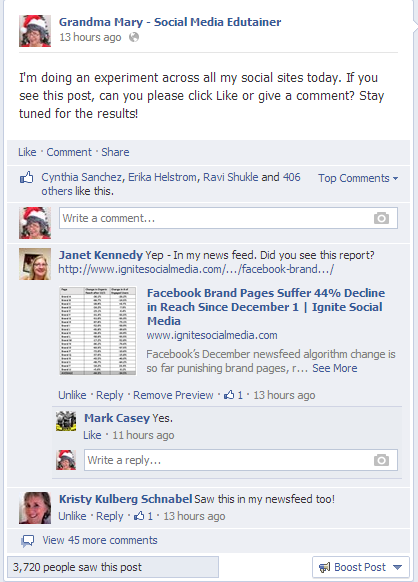
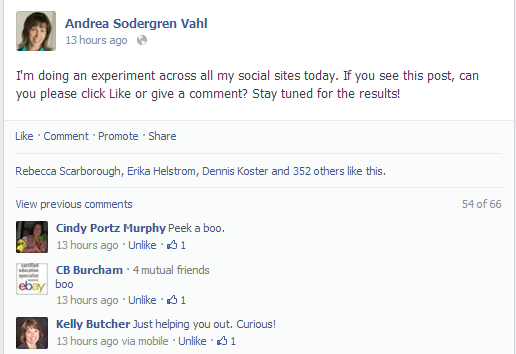
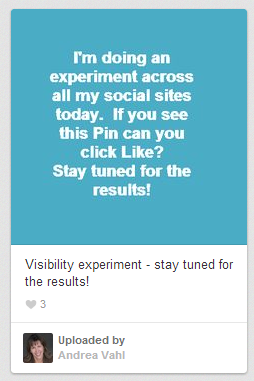
I posted a simple call to action across all platforms at the same time asking people to “Click Like or Comment”, “Reply with a Yes”, “+1 or Comment” and whatever the appropriate lingo was for that social site. Note that for Pinterest I created a very generic photo to pin and Instagram I took a picture of my cat, Mavis.
Then I tracked how many Likes (or Like-equivalent) and comments the post got each hour for 4 hours. Then how many total interactions the post had after 7 hours and 24 hours.
Before we get to the hard data, let’s look at how much I post on each platform and how many followers I have.
- Facebook Andrea Vahl: 1829 Friends and 9539 Followers (8070 via Lists). That does total up to a good sum but I wasn’t sure how many of the people who followed via lists might be actively looking at those lists. I am fairly active on Facebook posting at least 1-2 times per day on my personal profile during the week.
- Facebook Grandma Mary: 10468 Fans. Grandma is also fairly active on Facebook, posting about 3-4 times per day on average during the week. The People Talking About This engagement percentage has been hovering around 3 – 4 % in recent weeks.
- Twitter Grandma Mary: 14412 Followers and on 345 Lists. Grandma has not been as active on Twitter. She tweets about 4-5 times a day with more of the content automated (don’t judge). She used to be more active but she really found she likes Facebook better. So I expected this number would be low (but not quite as low as it was!)
- Twitter Andrea Vahl: 10096 Followers and on 850 Lists. Again, I’m not quite as active on Twitter (I’m with Grandma on this one) but I participate in tweetchats from time to time, retweet people, and am on a lot of lists. So I was expecting this number to be lower but a little better than it actually was.
- LinkedIn: 2187 Connections. I post about 3-4 updates per week and don’t get a lot of interaction in general. So I wasn’t expecting this number to be very high.
- Google+: 3649 have circled me. I post even more infrequently here and get very little interaction. I comment on other people’s posts about 1x per week and post my own content 1-2 times per week in a good week. I really like Google+ but don’t spend as much time there as I would like.
- Instagram: 227 Followers. I just started using Instagram a few months ago and have really enjoyed it. I post personal pictures of my business travels and general scenery shots from the beautiful place I live and get good interaction in general. But I wasn’t sure what to expect from this experiment – wow was I surprised. Hope I will soon get lot of Followers on Instagram.
- Pinterest: 698 Followers. Pinterest is one of my most inconsistent places I participate. I love Pinterest but almost avoid it because I get sucked into it for hours at a time. I knew my Pinterest interaction would be very weak.
Now you have a little background about how I use my sites. You may find that you get much better results from different platforms that you participate on more regularly – if you are a Google+ guru, then you would probably see vastly different results from Google+ than I did for example. Let’s dive into the data.
The Results
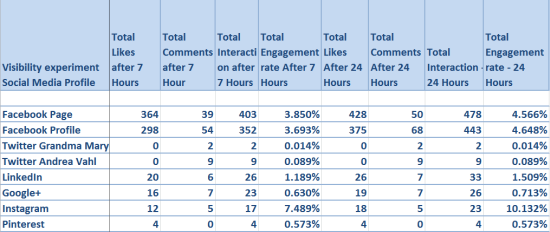
I recorded the total number of Likes (or Like equivalent) and comments each hour for 4 hours to see how each social site preformed and how visible each update was over time. Then I also recorded the total Likes and Comments after 7 hours and after 24 hours. You can see the initial numbers I charted here:
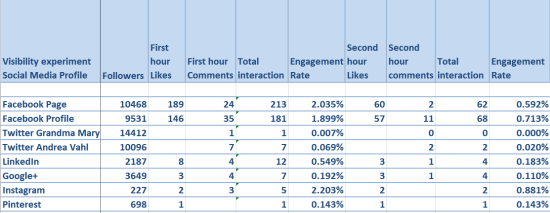
The total number of Engagements each hour is a little skewed by the sheer number of interactions on Facebook.
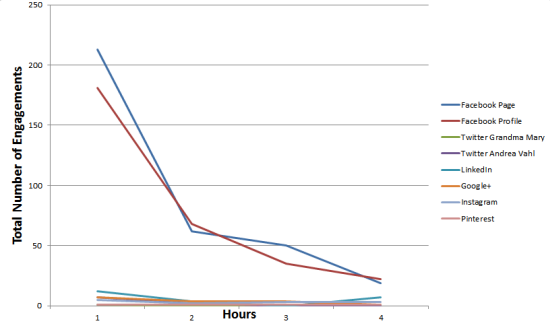
But when you look at the Engagement Rate (total number of interactions for the hour divided by number of connections on that platform) each hour, the results are extremely interesting. Twitter drops to 0 after the 2nd hour and the other sites have a much longer tail of visibility and engagement.
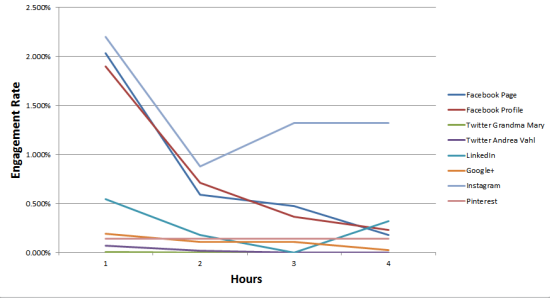
The most surprising result of this experiment was that Instagram performed the best for me in terms of engagement and it had a very long tail.
And the other amazing thing was the continued success of the Facebook Posts. The posts continued to pop up into people’s News Feeds a day later – many people commented that after 24 hours (and after they had already Liked and/or Commented) that the story was again at the top of their News Feed. This is a direct result of the Story Bump which other social sites don’t have. You can see from the chart after 7 hours and after 24 hours that I continued to get interaction on Facebook (many people check their feed in the evening).
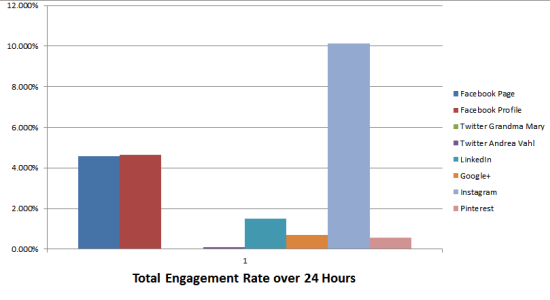
Then looking at the chart over overall interaction after 24 hours we have a clear winner in Instagram. Now I don’t use Instagram for a lot of heavy business posts. So maybe this experiment is slightly skewed. But what I also see is that Facebook continues to dominate in terms of effectiveness for me.
I went into this experiment knowing that Facebook was doing well for me. But what I see is the sheer volume of comments and interaction and I know that Facebook is still where it’s at. Even with their latest Organic Reach change it continues to outperform the other sites by a wide margin. In fact, if you look at total interactions over 24 hours, my Facebook Page won. Not quite a fair comparison since LinkedIn, Google+, Instagram, and Pinterest don’t have the same number of followers but the Page did extremely well in Engagement Rate also.
I’m wondering about the wisdom of continuing to participate on Twitter. I like Twitter. Twitter drives traffic to my site from people tweeting about my articles. But I may need to rethink my strategy with how I spend my time there.
I’m definitely going to be focusing more of my efforts on LinkedIn and Google+. If I can get decent engagement there with minimal effort, just think what can happen with a little more participation!
And Pinterest…..I think I’ll continue to leave that for recipes and decorating ideas. I know many marketers who are doing fantastic things with Pinterest but we all need to make choices with how we spend our time.
So how about you? Have you done any experiments on social media to see which social site is most effective for you? I’d love to hear about it in the comments below!


I’m so glad you did this, Andrea! I love experiments and research like this. Too many knee jerk reactions.
Now, I will say the Instagram entry isn’t particularly apples to apples. Come on… a CAT PHOTO?! You know that’s gonna get interaction!
Good stuff.
I know, I know – totally gamed it. 🙂 Thanks Jon!
Andrea, this is really fascinating info. Thanks for taking the time to conduct the survey, compile the results and then share it with us. My focus has been primarily on Facebook, as I believe that is where my target market spends the most of their social media time. What I like to do is follow the social media influencers like you on Twitter, retweet and favorite their posts, and also post the blogs and other linked items over to the appropriate board in my Pinterest account for future reference.
This is great, Andrea, and it mirrors sort of what I’ve seen. Over Thanksgiving weekend I spent some time reviewing my interaction on Facebook, Twitter, and LinkedIn.
What I found was that I get an average of 10% engagement on Facebook and LinkedIn and 2% on Twitter (clicks and likes). And Twitter has never really been a driver of traffic to my site historically.
I’m really finding that the dark horse is LinkedIn and I’m starting to spend more and more time there (which is more appropriate for my business).
Andrea I love this. I’m wondering do you think that since you are most active on Facebook (you admitted you spend the least amount of time on Twitter) that you’ve invested the time in the development of those relationships and that is why you got the most response? I mean, if you invested the same time in the others, would they have performed better? Or is it just because of Facebook’s story bump that it seemed to help the engagement most?
Andrea, great article as usual. What percentage of your Instagram followers are personal friends vs Twitter followers though? Still, it’s good to know Facebook is still trucking along for brands. Mike Allton (thesocialmediahat) did a recent article in which he argued this Facebook algorithm change means the end of un-paid interaction for businesses. I wrote a spirited counter-view in his comments, and would love to know what you think. Cheers!
But I loved the photo of your cat anyway!
It was really interesting to watch throughout the day, Joyce! And I should mention that I do actually get some good traffic from Pinterest even though I don’t participate there regularly. But it’s mostly other people pinning my articles with the sharing tools I have. And same with Twitter too. So it’s a matter of allowing the sharing buttons but focusing your efforts where you get the most bang for your buck. Thanks Joyce!
That is really interesting to know Jen and makes sense for your business. Well I’ll see you over on Facebook and LinkedIn then 🙂
Great question Kimberly! I was much more active on Twitter a year or so ago so I probably would have gotten better response then. But I definitely don’t think I’d see any additional tweets 24 hours later like I got extra interaction on the other social sites. I feel like to be really engaged on Twitter you need to invest a lot of time compared to the other social sites. And some people just have their routine based around checking in on Twitter while they are out and about so if it’s working, then don’t mess with it. But I think everyone could benefit from a test like this to see what’s working best for them. Thanks for your thoughts!
That could be the secret, Dennis – more cat photos 🙂
This was a great article and I have really been following the Facebook Reach debate recently. Some of the points you made really changed my mind about how I feel about Facebook. I still do not like that they are turning towards “pay to play” because it makes it difficult for people who are just trying to share good content. Thanks for the research!
Thanks James and I so agree with you on this! I think we do need to reframe the way we think of Facebook – it’s more of an “optional” subscription model. If you pay a monthly ad fee (subscription) you’ll get better results but you can still get some results for free.
I just started following you, Andrea, mainly by your email, but always find your words totally engaging and interesting! You have a gift! Perhaps because of your strength in conveying information with stimulating words, you shine in those medium. I want to know more. More. More. And you are there to teach me! Thank you for the work that you do!
I use a laptop, iphone & ipad at different times of the day & for different purposes. I find that mobile devices often show posts days old in my “most recent” newsfeed. Sometimes that alone can keep a post active.
Andrea, this article is great as a case study. But I wonder if we’d see different results from a different industry than the one industry you’re in. Who follows YOU (and Grandma Mary) on Facebook et. al. aren’t just marketers from big brand companies. My guess is that you have a lot of people who technically compete with you (e.g. other social media consultants, providers, etc.) And those folks are more actively engaged that other industries by their very profession to keep up with what’s going on. Agree?
It would make for an interesting summary to do a study like this done for some different industries in B2B and B2C markets where engagement is already significantly different than what you see with marketers. Examples: Healthcare, Nonprofit, Grantwriting, Law.
It’s a very interesting debate. I just read a totally opposite view from someone who tracked that their Google+ account way outperformed their Facebook Page. Well they had 100K followers on G+ vs 1K on Facebook so of course that will happen. I think it comes down to the fact that you can make almost any platform work for your business (as long as your customers are there). But if you have an engaged audience on Facebook, I don’t think we should give up on it – we just need to strategically invest some dollars there now.
Aww thanks Laura! So glad to hear!!
Yes that’s where I think people benefit from Facebook – your posts can keep popping up hours (or even days) after you first post them. Facebook realizes that if they showed “everything” in the News Feed, they would just be another Twitter. Thanks Georg!
Yes I totally agree Kristine! I think that would be an extremely interesting case study. And I just read one where someone had the exact opposite results with Google+ and Facebook but they had a much bigger following on Google+. I definitely don’t want anyone to use my numbers as an example of why everyone should still participate on Facebook. But I think that everyone should do a case study for themselves and see where their engagement is. I also think that this case study represents the fact that Facebook is still effective if your audience is there – just because the organic reach is going down, we don’t have to abandon Facebook….yet 🙂
Great stuff. And WOW, that was some effort… very scientific. I am also bumping up my engagement/posting on Google+. I believe Google is skewing it’s authority and rankings with the social activity on its own platform.
I haven’t engaged in any “hang-outs” but I think this is a cool feature that Google+ offers — and if it’s a great discussion, it’s already recorded and can be shared!
I agree with you about Twitter and LinkedIn. I spend the majority of my time and effort on Facebook and gearing up on Google+.
Thanks for the great article — interesting topic and debate.
Andrea, I was one of your friends who saw your Facebook profile post about this experiment yesterday, I “Liked” it, and now, happily, just read the results in this fascinating article you wrote.
I agree with you on your opinions about the social networks – I feel almost the same as you do about each one (especially Pinterest: you can get sucked in for a long time. It’s almost hypnotic).
Regarding Twitter: It can be used in combination with LinkedIn for some powerful networking.
I’m not surprised that your Instagram engagement is so high. It’s because we love you and get to see more glimpses of your personal life that you so kindly share with your followers.
I enjoy everything you create. You’re so funny and so delightful and I can’t wait to see more of your ideas come to life. I can attribute many of my “belly” laughs this past year, thanks to your sense of humor.
p.s. hoping you leverage this research and turn it into a SlideShare presentation; and also, maybe Grandma Mary can record a video reporting about how Andrea experimented with her social networks and what the results were.
Total smiles reading your findings and the comments below. Your followers are as interesting as you.
But seriously, the results were very beneficial and although I’ll be testing further for my case, my gut (I know, guts aren’t very accurate) has told me the same about FB and T. Instagram was a bit of a shocker but in my experience, people click that little “heart” no matter what.
I use G+ and am sure the google juice has got to be beneficial and I even enjoy the engagement at times but I don’t think it will ever have the close, friendly appeal of FB.
Although I use and appreciate the affiliations I form in Linked In, I don’t believe I’ve ever received any increased biz benefits from it.
Thanks for sharing your work and results and motivating me to verify which SM paths are best for my biz.
Cat with bacon would have really skewed things up!! 🙂
Well, you know me. I have lots to say about all of this. Kudos to you for talking the time to do this little experiment. And I know you know this, but if you spent as much time on G+ as you spend on FB the results would be completely different. You’ve spent years developing your audience on FB. If you were new to FB and spent your time equally across all sites – I bet Instagram would have still won. THIS would be a fab topic for a podcast…
Very interesting. About the only reason I want to give FB a chance is because you dig it, Andrea. I use it for fun but am still leery about it for my business. I’ll get there, though. Thanks for the bump.
I know it’s not for everyone David – you can hang out just fine on G+ and Twitter if you want 🙂 Good to see you here too 🙂
That would be totally interesting! We could do a case study with a business and see what wins 🙂 I’m going to go hang out on G+ now – see you there 😉
Thanks Teri! I love my peeps! Good to know that you are thinking along the same lines but also good that you are going to do your own testing. Google+ keeps claiming they have big numbers over there so maybe people are migrating over. I’ve definitely gotten business out of LinkedIn – people have hired me and told me they found me there. So that’s a good thing. But I think it depends on the niche. Thanks for stopping by!
Thanks so much Lori! A slideshare presentation is a great idea – I am going to have this in my webinar next week so that will be good. And it’s been too long since Grandma has done a video. Glad to hear your thoughts on this too. And thanks so much for your kind words – I’m so lucky to count you as one of my friends!
Thanks Deb! I love hangouts – it’s one of my most favoritest parts of Google+ I don’t usually do spontaneous ones but more the mastermind pre-arranged meeting ones and it’s a fun way to keep connected with a group. Glad to hear what you are doing as well! Hope to see you sometime soon!
And a baby. 🙂
I LOVE that your results validated the benefits of Instagram marketing! I am always telling people this and I love seeing others get the same results!
I honestly believe that you can substantially boost the engagement from Google+. I have been getting more active there and am seeing increases in my levels of engagement and followers.
Thanks so much for running this study! I just ran an analysis of my Facebook news feed (similar to Jon Loomer’s but with more detailed data). I was impressed as a user at the distribution of page posts in my feed but was reminded of the hard work it takes to get our posts into others’ feeds. I’ve been contemplating running an experiment much like yours too.
Thanks so much for doing this and sharing your results!
I have just finished an experiment on Pinterest, In 60 days of hard core pinning my web traffic went from 50 visits a month to 400, trouncing Facebook. I think Pinterest is great for my lingerie website but I wouldn’t use it for the consultancy biz.
Thank you for doing this! I also did the same experiment. Same results. I am thinking it is because people like you have shown people how to respond to posts. 🙂
One quirky point about Instagram – very often (in the UK) people post there under pseudonyms, although I don’t. I found that, if they like what they see of mine, they quite often ‘come out into the open’ and start following my Facebook Page and joining in there. Since interaction is paramount for me, this has been a great help in building up a community. BTW, your Dummies book has been a great help too!
Very good stuff, I liked the post that New Media Expo put up about your experiment. It got me thinking that I should put a call to action near he social media buttons on my sites. Encouraging readers that like your stuff already is a no brainer. http://vinnyohare.com/add-call-action-near-social-media-buttons/
I agree that Pinterest is awesome and for many even better than Facebook, as long as the industry is right.
I agree with this, most of my friends who are in Andrea’s industry have much better results on Google Plus
The power of Twitter comes from real time interaction. From a quick glance at your accounts, it appears you have very little of that. You can’t expect to get engagement on Twitter if you aren’t giving it.
Thank you for sharing your wonderful easy-to-read and follow experiment experience!
Well done Andrea! Thank you for sparing your time on writing and sharing this!
That is very true Collin and I fully acknowledge that in my post. I’m not participating there like I used to – I just mostly use it to post articles, retweet others, and participate in tweet chats these days. Which I’m wondering if there is any benefit in even doing that if I’m not going to use the platform like it was meant to be used.
Wow – that is very interesting Katherine – glad to hear how that experiment went for you! That is a big success but yes, I think the visuals are better suited there.
Hugs!
Your post title and description also played a great role in getting likes, shares and comments.
With such title many fans and friends clicked like button to show their contribution.
Would love to see if you will try this test on your day to day post.
Thanks for such an in depth analysis.
Really appreciate your effort 🙂
Well done Andrea! I love experiments!
Totally agree. This is why case studies like this are so important. They take time (so thank you for doing it!) But they can really help when benchmarking other industries. I use them frequently with clients who want to compare how they are doing with others in the same industry. The take away from all of this what channel you are on has to be where your audience is and if you pay attention to what’s happening in that channel (or channels) you should be able to tweak and modify to improve engagement. But engagement shouldn’t be THE number we marketers focus on. If that engagement is not driving results that are working toward bigger business objectives then the methodology needs to be modified a whole.
That is really, really interesting. Thanks so much for sharing your results to help us all make social media decisions!