
Do you have the new Facebook Insights yet? They are rolling out more widely to everyone now and some of the new features are pretty cool. Other areas are a bit lacking but read on to find out exactly which sections of the new Facebook Insights you need to pay attention to, and which sections you can ignore.
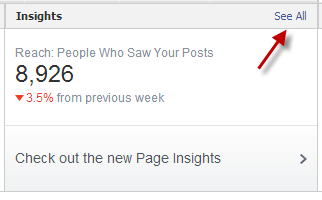
First, the navigation is a little different than before and you don’t want to miss anything in your initial review. To get to your Page Insights, you can either access them via your Admin Dashboard at the top of your Page by clicking the See All link:
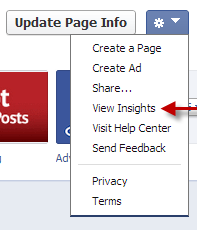
Or you can use the wheel underneath your cover photo on the right side of your Page and select View Insights.
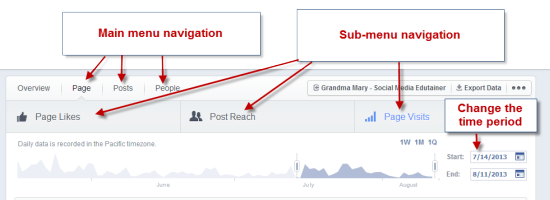
When you get into the new Facebook Insights, there is a main menu and a sub-menu for each section. Make sure you familiarize yourself with each area so you aren’t hunting around for your key metrics and so that you don’t miss anything.
Also know that you can change the time period of evaluation for all your stats. The time period affects the bench mark statistics that we will cover later. Right now it looks like the maximum time period was back to May 2013 – I’m not sure if that’s due to the roll out of the new stats or if 3 months is a maximum.
Another important note with the new Insights is that most of the graphs will give you more information when you click on a certain date or area. Now let’s dive into each section and I will highlight the best parts and what you can skip.
Overview section – Skip
The first section that you land on is the Overview section – skip this page. Nothing that interesting to see there.
Page
Within the Page menu you have Page Likes, Post Reach, and Page Visits as sub-menus.
#1 Page Likes – Where Your Likes Came From
The graphs on the Page Likes area are interesting as a trend but you may be more interested in the last graph, Where Your Page Likes Came From. You can click on any date to get more of a break down on the individual numbers.
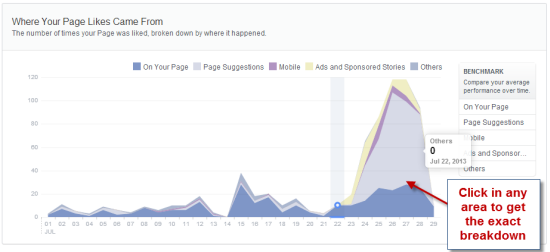
Watch for any big changes in this area to see if different tactics bring you different results.
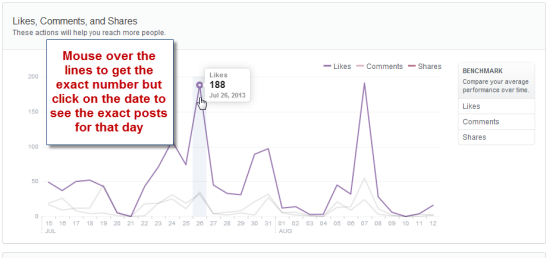
#2 Post Reach – Likes, Comments, and Shares
The top graph in this section shows your Reach and again, if you click on any section, you can see more about the posts that were on that day. But I’m more interested in knowing what brings engagement and that is shown in the second chart.
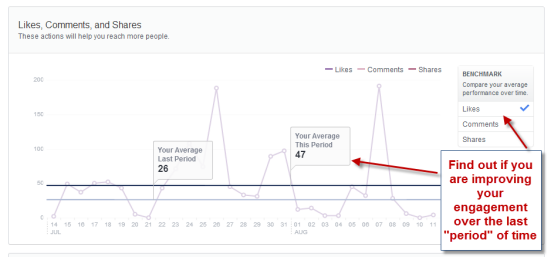
Now you can use the Benchmark feature to see how your current metrics compare to the previous period. Just click on the Likes, Comments, or Shares selection under the Benchmark box.
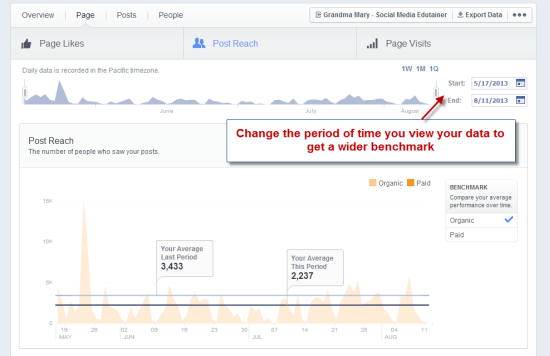
At the top of the Page, you can change your period of comparison.
#3 Page Visits – Page and Tab Visits
What are people consuming on your Facebook Page itself? Are tabs worth it? Find out where people are looking each day with this graph. Mouse over the sections to see each number individually.
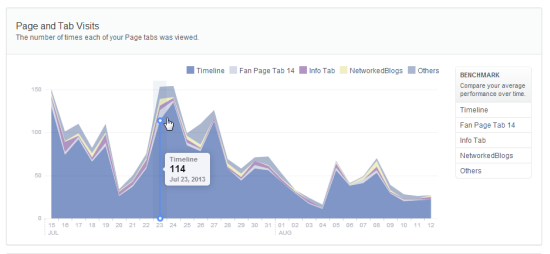
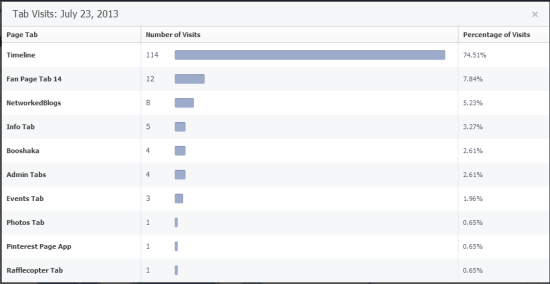
Or click on the date to get a breakdown of the numbers. Make sure that your tabs are up to date if people are looking at them!
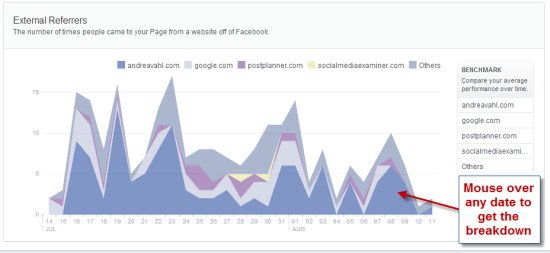
#3 Page Visits – External Referrers
This has always been one of my favorite features of Facebook’s Insights because you can see which external links are sending traffic to your Facebook Page. Just mouse over any date to see more information or click on the date to see the exact websites if you have some in the “Other” category.
Posts
The next section on the Facebook Insights main menu navigation is Posts and there are lots of great nuggets of information in this section. The sub-menus here are All Posts, When Your Fans are Online, and Best Post Types. In my opinion you can skip the “When Your Fans are Online” graph – it mostly tells you that they are online all the time except for a slight dip at 3 a.m. It may skew slightly one way or another but it is mostly irrelevant information – your Fans are on all day and all evening.
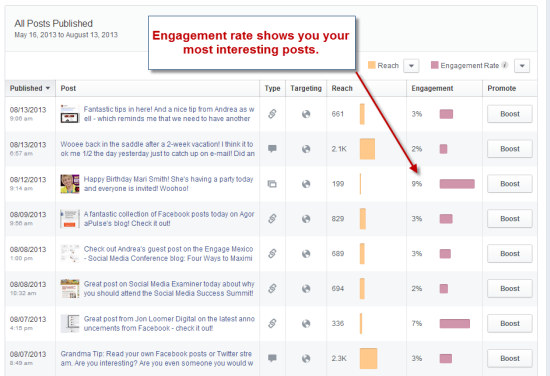
#4 Sort Posts by Likes, Comments, Shares and Engagement
Use the drop-down menu on the upper right of the All Posts area to show you different metrics. You can look at Post Clicks vs Likes, Comments & Shares, or break down each post by Likes/Comments/Shares, see Post Hides and then look at Engagement Rate.
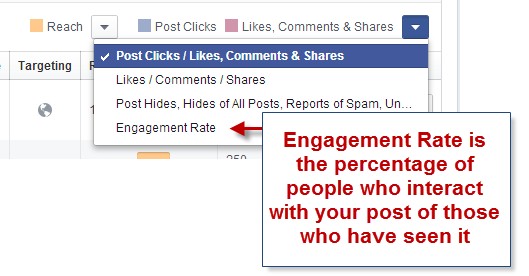
Engagement Rate is a good metric because it takes into account the people who have seen your post and gives you the percentage of people who interact with your post of those who have seen it.
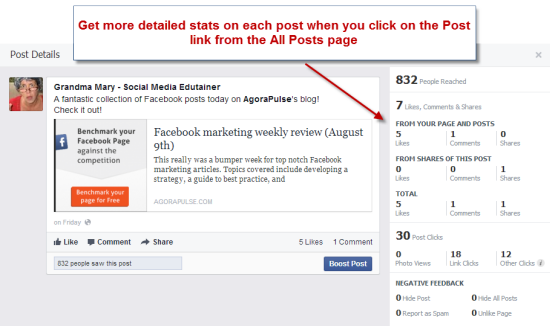
#5 Dive deeper into individual post stats
If you click on the Post hyperlink from the All Posts page, you will get more information about how the post performed.
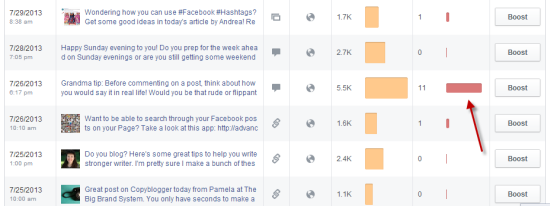
#6 Watch Your Negative Feedback
Watching your Hides has never been easier than with the new Facebook Insights. Just select the Post Hides, Hides of All Posts, Reports of Spam, Unlikes of Page from the drop-down menu on the All Posts page. You can’t please everyone and there will be people who hide your posts so you can’t worry about this metric too much but it’s good to watch.
Often if you have a post that gets a lot more Reach or goes a little more “viral” then you will see an uptick in Hides. That’s ok.
Grandma Mary did get 11 hides on this post and it may have been because she said a bad word in her post. Or maybe it was just because it had a lot of visibility – hard to know. In any case, she still is going to swear occasionally – you can’t please everyone.
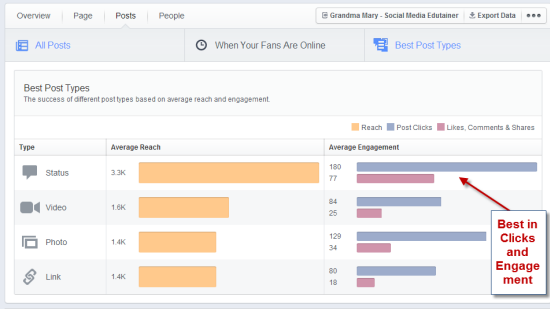
#7 Look at your Best Post Types
I like this page because it really breaks down how each type of post performs for your individual Page. You can compare Reach vs. Engagement and see where your sweet spot is.
You can see that my best Post type is Status because it gets the best Reach, the best post clicks, and the best engagement. But Photos are good too. This doesn’t necessarily mean that you should post all of that type of post – you always need to mix it up. Just make sure you are doing more of what works best.
People
Skip….sort of. The People section of the Insights shows you a lot of different breakdowns of the Demographics who Like your Page. That’s great information for when you want to run a Facebook Ad and you also probably want to make sure you are catering to your audience demographics in the types of posts you provide. The Demographics isn’t information you need to pay attention to day-to-day or even week-to-week. Check in with this data once a month to watch for changes but there isn’t any need to monitor these stats closely unless you are running Facebook ads.
Facebook Insights are a tool to help you market better. Don’t be a slave to the numbers there but use them to help you be more efficient on Facebook. Make sure you are increasing numbers of what is important to you – sales, e-mail subscribers, website traffic and other key performance indicators for your business.
How about you, have you checked out the new Facebook Insights? What do you like about them? Share your comments with us below!


What is a good Engagement Rate on a Facebook Page or Post?
It depends on your audience and the size of your Page. You can get a feel for what other Pages get in engagement in general by using the AgoraPulse barometer tool: http://barometer.agorapulse.com Hope that helps!