
Are you wondering how often to post on your Facebook page?
Do you know whether Facebook post frequency or content has a bigger impact on engagement?
For a recent post I did for Social Media Examiner, we did some testing, and dug into our Facebook metrics.
What we found are some very interesting things about Facebook reach, posting frequency and what matters most to get the engagement you want.
In this article I’ll share what we tested and how you can find your own data and determine what works best for your own audience.
What Should Your Facebook Post Frequency Be?
Facebook has changed the news feed algorithm, that’s for sure–everyone is talking about a decline in reach. Since fewer of your fans may be seeing your posts, what worked in the past may not work now.
In the past people have advised posting between 2 and 5 times per day, but those studies are outdated. However, even more recently, Bufferapp suggested posting 2 times per day on Facebook, 7 days per week. But does any of that advice—old or new—work for everyone?
Instead of relying on other people’s data, do your own testing to determine what works for your audience. You may find some surprising results.
Find Your Baseline
The first thing you want to do is make sure you know what’s already working for you.
Start by going to Facebook Insights and selecting Reach. Change the date range to see how the reach of your posts has been doing over time. Make a note of any large changes in engagement. (You may see a gap in the Facebook data for April, as we did.)
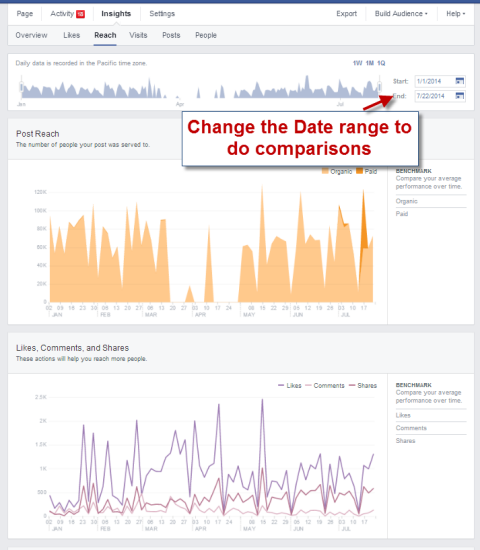
Take a look at your post reach and likes, comments and shares.
Use the data from your given timeframe to determine the average engagement for your page and use that as the baseline to compare with future data.
One thing that surprised us when we looked at Social Media Examiner’s Facebook reach was that it hadn’t declined as much as we had thought. Even with the new algorithm change, there wasn’t the huge dropoff others were reporting.
With your own baseline set, it’s helpful to know how other Facebook pages are doing so you can get an idea of how you compare. Facebook’s Pages to Watch feature makes that task easy. If you haven’t set it up, now’s a good time to do it.
The Pages to Watch area is in the Overview section of your Insights and is available if you have at least 100 people who like your page.
Of course, you’ll want to add your competitors’ pages, and since you can watch up to 100 pages, add pages outside of your niche as well to see what’s working for a broader audience. Keep an eye on how many times these pages post each week and what type of engagement they have.
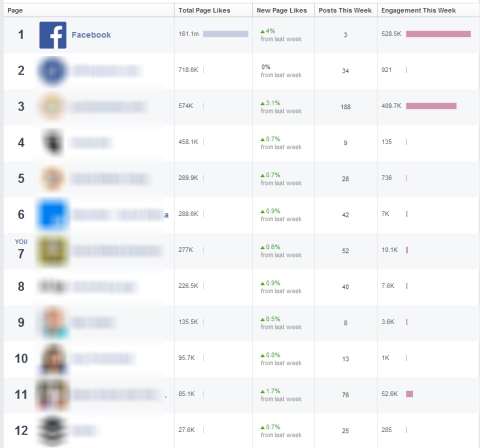
Watch competitors’ pages and even pages unrelated to your niche to see what works across the board.
It’s easy to add and remove pages from your list. If you just need a quick snapshot of a page’s performance, you can add it and then remove it if you don’t want to keep monitoring it.
Do Your Own Testing
At the beginning of this article I explained the importance of determining what works for your audience instead of assuming general advice is a rule.
I’m going to share how we used our Facebook Insights to compare and measure posting frequency and engagement over time. You can use the same method to do testing on your own page.
We compared a week where we posted updates more frequently than usual with two weeks where we posted updates at a regular (lower) rate.
The week with frequent posts was July 12-17 (44 posts) and the weeks with fewer posts were July 5-12 and June 28-July 5 (28 and 29 posts respectively).
In Facebook Insights we set the date range (in this case July 12-17) and clicked the Benchmark option to see the average reach, likes, comments and shares compared to the previous period. Notice that our reach numbers didn’t change significantly despite the increase in posts from the previous week.
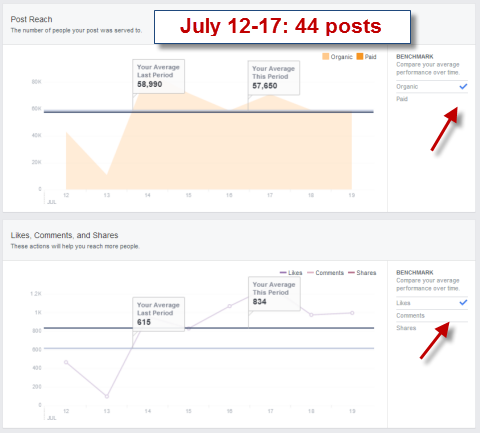
Go to Post Reach in Insights to compare stats.
Next we looked at the week before (July 5-12, when we posted less regularly). When we looked at the likes, comments and shares graph, we saw a decrease in those numbers during the week of fewer posts.
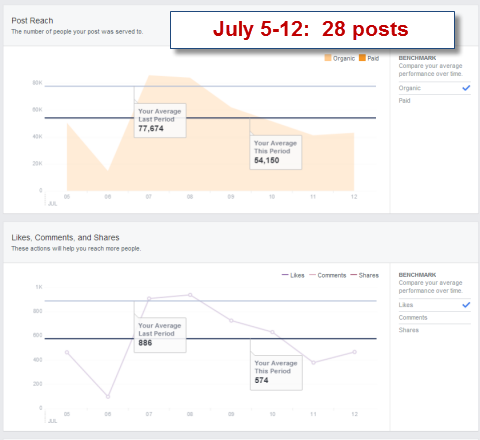
Experiment with posting frequency and compare stats.
But to dive just a bit deeper, we went back one more week (June 28-July 5, also with a less-frequent posting schedule) to see what type of interaction and reach we got that week (note also that it was a holiday week in the U.S.).
When we compared the week of June 28-July 5 (when we posted less frequently) with the week of July 12-17 (when we posted more frequently), we saw that the week with fewer posts had higher reach and more likes.
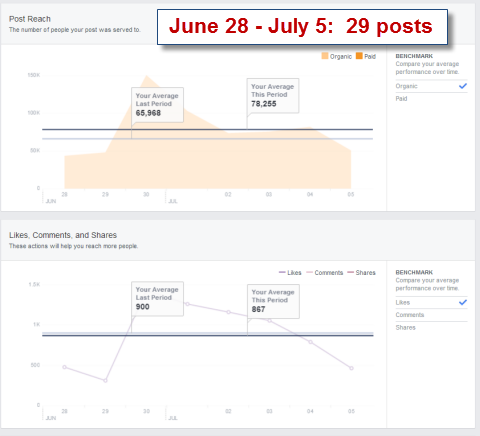
Compare your reach over several weeks to get an idea of what’s really working.
Obviously this is just a snapshot of our data over three weeks, and more testing and comparison are needed, but I think we can say that posting frequency isn’t necessarily the driving force behind engagement.
As you apply this testing method to your own page, I encourage you to compare several weeks of data to find trends for your own posting schedule and engagement.
Analyze the Data
To see a more accurate view of trends over time, look at a range of dates and compare reach with likes, comments and shares data. In the example below, we looked at the month of July.
What we found was that our page reach corresponds to likes, comments and shares. That’s not surprising, but it supports our previous results and suggests that finding the best content for your audience is more important than worrying about Facebook reach and changing algorithms.
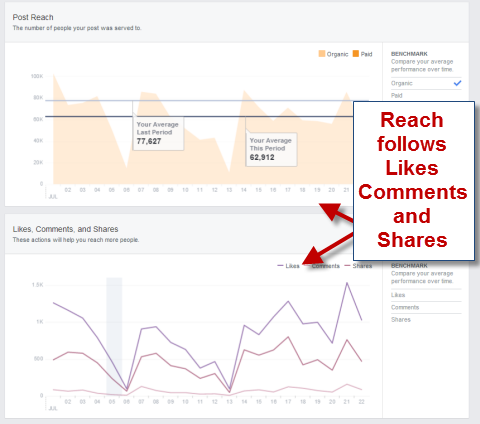
Your page reach is closely related to likes, comments and shares.
To figure out what kind of content you should be looking for and sharing, dig into Insights and find your most viral content from the last six months. It’s a good bet that type of viral content will work for you now as well.
The easiest way to find your viral content is to use the Export feature and select Post Level Data. You can only download 500 posts at a time, so if you post a lot, you may have to export a series of files.
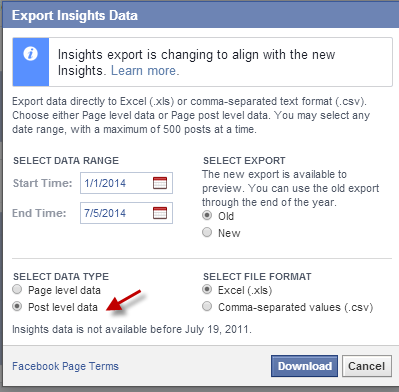
Export Post Level Data to see what’s popular with your fans.
Open your exported Excel file and look at the Lifetime Talking About This Tab.Create a new column in that tab (shown in the image below as Engagement) that calculates the sum of the three columns labeled comment, like and share.
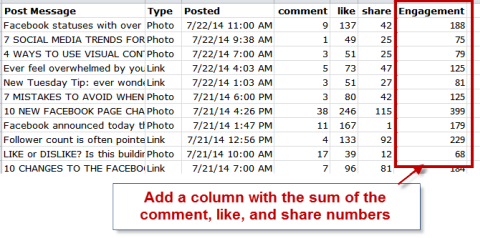
Add together the comment, like and share columns.
Do a custom sort in Excel by the Engagement column that you just created.
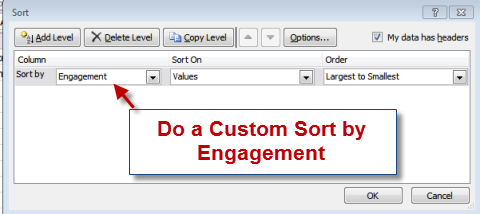
Find your post with the most comments, likes and shares over a long period.
Now you can easily see which posts are getting the most engagement over a period of time.
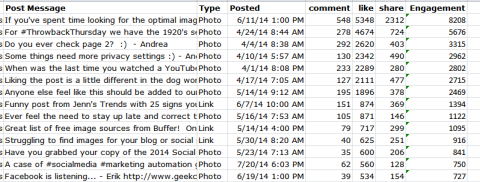
Sort your top posts to find any topic trends.
From here you can do other experiments. For example, find and post a different angle on popular topics. Or try reposting the most popular updates to see if you get a similar response. It doesn’t hurt to repurpose content because not everyone in your audience would have seen it the first time.
Over to You
You can find a lot of advice out there telling you when you should post on Facebook to get the most visibility and engagement. Instead of taking it at face value and applying it to your page across the board, do some testing to find out if the advice works for your audience.
We’ve shared one way we experimented and compared data using Facebook Insights—we hope it gives you a place to start and an idea of what to look for and measure. It’s important to do your own testing to find out what works for you.
You can see from our data that there’s no magic number of posts per day to get more engagement—in fact, content may play a larger role than post frequency. However, I recommend posting at least once a day so you don’t lose momentum.
What do you think? Are your Facebook posts performing well? How often do you post on your page? Have you found the topics and times that work best for you? Share your thoughts with us in the comments below!
Note: This article originally appeared on Social Media Examiner and is reprinted with permission.


Thanks for covering some questions I’ve had about about Facebook reach. I know that Social Media Examiner is a larger publication and is on the higher end of frequent postings with many engaged followers. You’ve inspired me to run my own test on how the numbers change (or not) for smaller business pages.
Andrea – In addition to this post being an excellent primer on how to analyze your own post frequency, it also highlights a key point – what works for other pages, or for pages in aggregate, may not work on your own page. Every audience is different. Every business is different. Every FB page is different in style, goals and strategy. Further, collating data across pages, imho, is useless unless the pages reflect businesses that are very similar in size and audience. I always take these studies with a large grain of salt!
Forgot to circle back to this Christina! Thanks so much for your comment and I definitely think it is so true- you need to run your own experiments because sometimes what works for the larger pages doesn’t always match what works for the smaller ones!
I agree Terri! It’s ridiculous to say that everyone should be posting at 3:42 p.m. on Tuesday to get the best results. I’ll have some more posts on experiments I’ve run coming shortly!
Great to see a post that teaches users to find the method that works best for them. Many are aware that there’s no “one size fits all” approach but lack the tools to analyze the data in a way that is useful.
Thank you! This is the first sensible article I’ve seen on this subject. I confess I have pulled back from FB out of shear frustration. Some of my colleagues are posting so frequently – and usually little more than a quote or image – that I’ve stopped getting updates. I’m definitely going to take a hard look at my stats and creating a baseline makes great sense. How refreshing!
IT seems FB has changed their tabs in the export excel file